Subscriptions
A complete guide to reading analytics for your subscriptions
This section of the documentation will help you understand how data about the subscriptions of your customers is displayed.
When you first login to the Tonos admin page, you will be redirected to the Dashboards page. From here you have to go the Subscriptions page, which is located in the Analytics section.
When you enter the Subscriptions page, the data is displayed like in the pictures below.
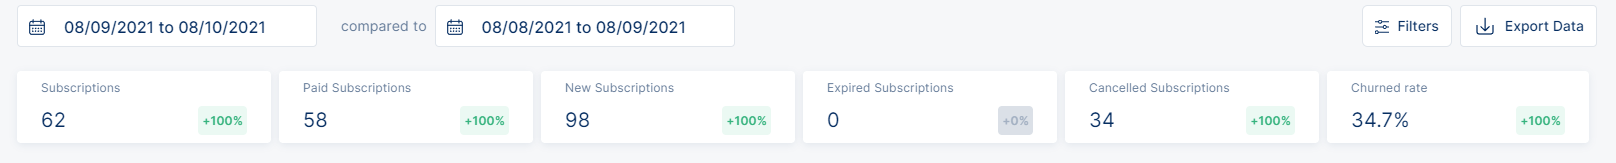
The percentage next to the metrics portrays the increase or decrease in values of the primary time period in correspondence to the comparison time period.
The lower bound time limit(starting date) is set at 00:00:00 CET(GMT+1) whereas the upper bound time limit(ending date) is set at 23:59:59 CET(GMT+1). e.g. If time period selection is set to a single day, analytics metrics are calculated for that single day from 00:00:00 to 23:59:59.
| Metrics | Description |
|---|---|
| Subscriptions | Intended to denote all the active subscriptions* as of the upper bound time limit. - Paid, Registered and Gift Subscriptions - Active Subscriptions are Subscriptions that haven’t been canceled or expired as of the upper bound time limit. |
| New Subscriptions TBD | Represents first-time subscriptions within the selected time period regardless of their churn rate or the status of their subscription. |
| Paid Subscriptions | Calculated by omitting Churned Subscriptions, Free Trials and Registrations from PaidNew Subscriptions Calculated by omitting Free Trials and Registrations from Subscriptions whose starting date falls within the selected time period. |
| Expired Subscriptions | Fixed time(non-recurring) subscriptions that have expired within the selected time period regardless of their subscription start date. |
| Canceled Subscriptions | Subscriptions that have been canceled within the selected time period without considering their subscription start date and the entity that has canceled the subscriptions in context. Admin and/or Client |
| Churned Rate | Intended to represent the rate at which customers leave the services of your products. It’s calculated as follows: A = Active Subscriptions as of the lower time limit at the start of the day N = New Subscriptions within the selected time period C = Expired + Canceled Subscriptions within the selected time period. Churned Rate =C/(A+N) |
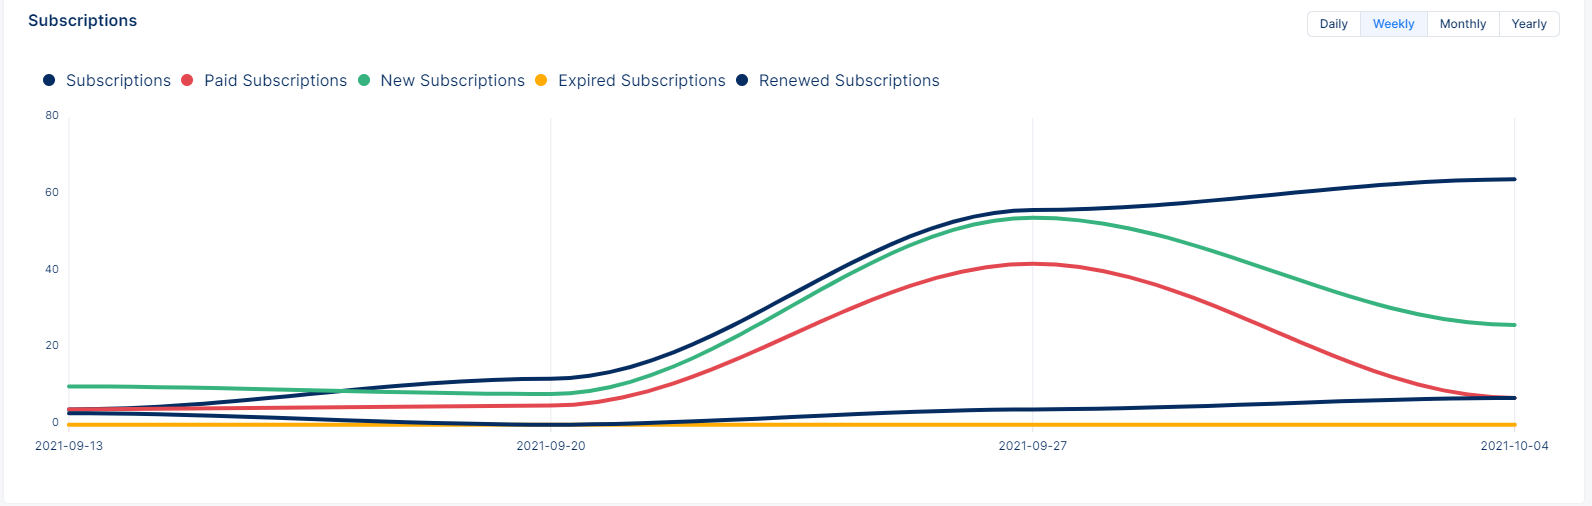
The graph has the same function as the boxes, but it gives a better visual representation.
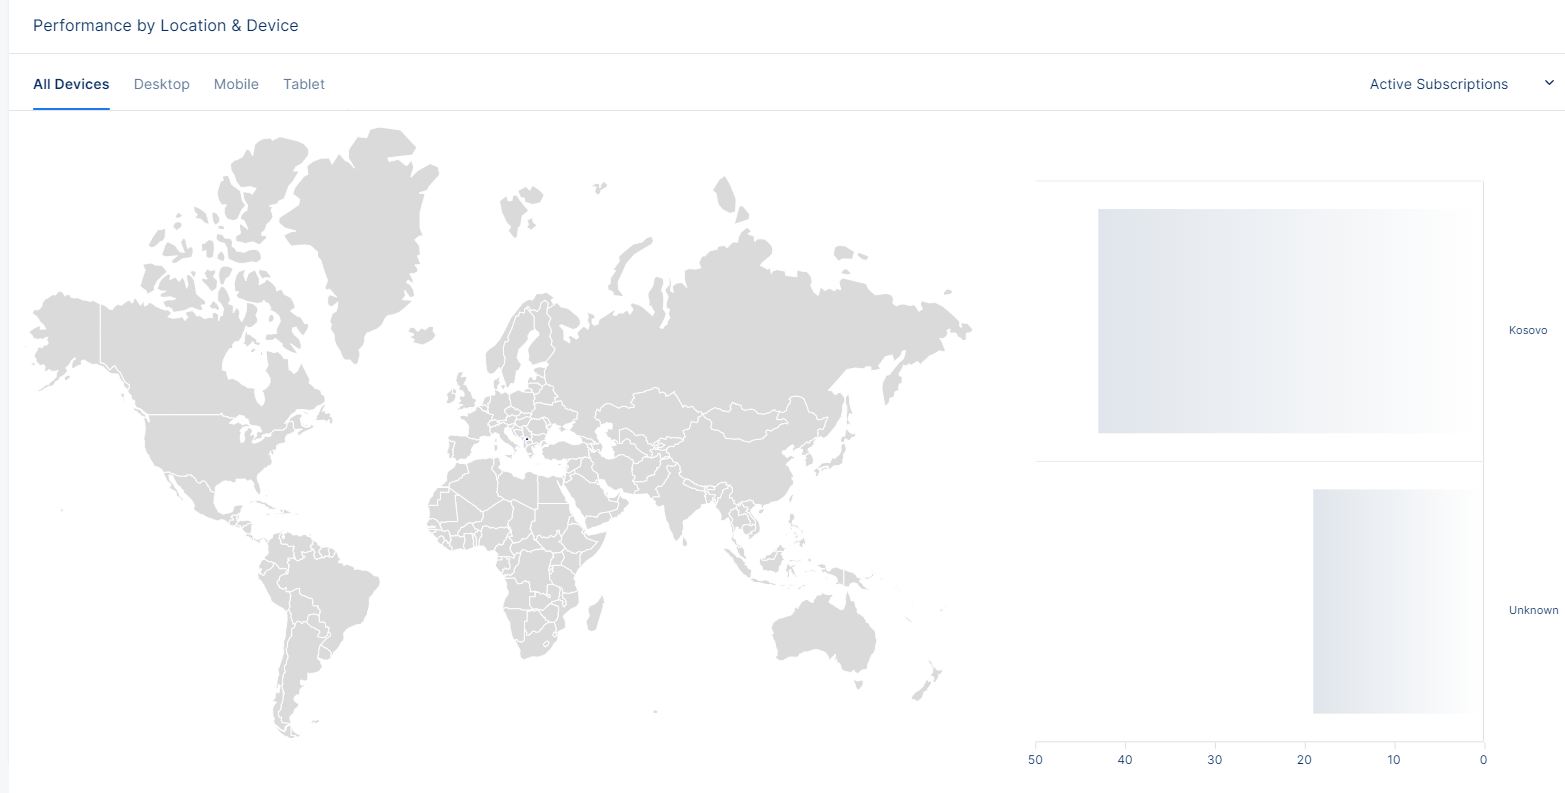
The last section gives the information you need based on performance by Location and Device.